Initial Balance Breakout Strategy (ES & NQ)
The first hour of the New York session sets the levels that govern the rest of the day. Breakout validation criteria, SMT divergence between ES and NQ, and low-timeframe execution.
The Initial Balance (IB) is one of the most powerful concepts in intraday trading for index futures (NASDAQ, S&P 500). Originating from Market Profile methodology, it establishes a structured, statistical framework to evaluate institutional order flow during the trading session.
1. Initial Balance Foundations and Mechanics
1.1 Definition
The Initial Balance represents the price range established during the first hour of the Regular Trading Hours (RTH) session, from 9:30 AM to 10:30 AM EST (New York time).
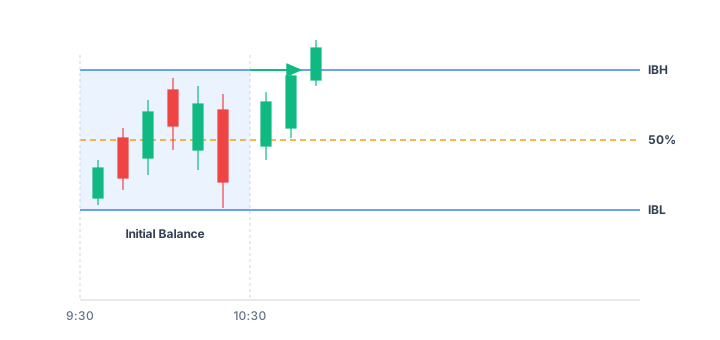 The first-hour range: IBH, IBL and the 50% midpoint, the reference levels for the rest of the session.
- IB High (IBH): The highest price point reached between 9:30 AM and 10:30 AM.
- IB Low (IBL): The lowest price point reached between 9:30 AM and 10:30 AM.
- IB Midpoint (50%): The exact median price level of the IB range.
Why the First Hour (60 Minutes)?
The first hour captures the transition from overnight trading (Globex) to the RTH session. During this period, institutions and major market participants adjust positions and digest economic data releases. Waiting 60 minutes establishes true value consensus, whereas 15-minute or 30-minute ranges merely reflect initial momentum.
2. Quantitative Framework & Key Statistics
2.1 The Single-Break Rule (77% to 85%)
Statistical research indicates that in 77% to 85% of trading sessions, price breaks only one side of the Initial Balance (either the IB High or IB Low, but rarely both).
Strategic Implication
Once an IB boundary is validly broken, the probability of price reversing to break the opposite boundary within the same session becomes extremely low. Traders should maintain a single directional bias.
2.2 Price Targets (Measured Moves)
On trend expansion days triggered by an IB breakout, price typically projects measured moves equal to 1x to 2x the IB range height.
3. Market Regimes & Auction Structure
3.1 Balanced Market (Inside IB)
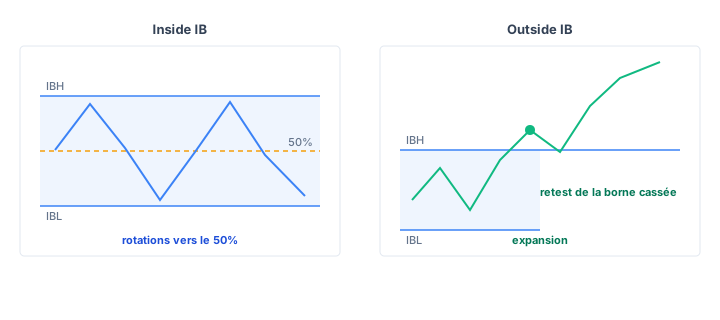 Left, price stays inside the IB and rotates around the midpoint. Right, it accepts beyond a boundary and expands.
- Price Behavior: Price remains contained within IBH and IBL boundaries.
- Auction Mechanics: Liquidity building and order accumulation phase (choppy price action).
- Approach: Focus on mean-reversion and rotational trades (fading extremes back to 50% midpoint or VWAP).
3.2 Unbalanced Market (Outside IB)
- Price Behavior: Price breaks out and accepts beyond IB boundaries.
- Auction Mechanics: Expansion zone where accumulated liquidity fuels directional trend moves.
- Approach: Focus on trend continuation trades on retests.
4. The 3 Core Execution Setups
Setup 1: Breakout & Trend Continuation
Objective
Capture directional momentum during institutional expansion days.
- Entry Conditions:
- Wait for a confirmed breakout above IB High (for long) or below IB Low (for short).
- Avoid chasing the initial break. Wait for a pullback to key confluence levels:
- The 50% level of an impulse Fair Value Gap (FVG).
- The VWAP line.
- The broken IB boundary (classic retest).
- Risk Management (Stop Loss): Place Stop Loss below the FVG or VWAP level, rather than the opposite IB extreme, to preserve risk-to-reward parameters.
- Exit Management (Take Profit): IB measured move projections (1x to 2x) or trailing stop via short-term moving averages (8 EMA / 9 EMA on 5m).
Setup 2: Failed Auction & Double Liquidity Sweep
Objective
Capitalize on false breakouts and liquidity traps to trade price re-entry back into the range.
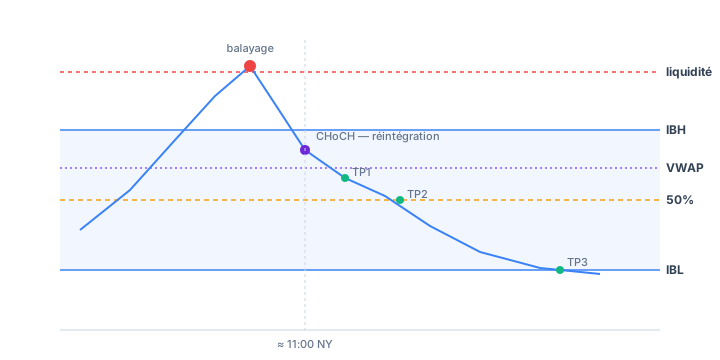 Price leaves the IB, sweeps external liquidity, fails, then reintegrates the range — targets chain toward the opposite boundary.
- Entry Conditions:
- Price breaks beyond an IB boundary, sweeps key liquidity (Asian/London high-low or previous day high-low), and fails to sustain auction.
- Price closes back inside the IB range, confirmed by a lower time frame Change of Character (CHoCH).
- Key Time Window: This pattern frequently confirms around 11:00 AM EST during the H1 hourly candle transition.
- Profit Targets:
- Target 1: Intraday VWAP.
- Target 2: IB Midpoint (50%).
- Target 3: Opposite IB boundary.
Setup 3: Midpoint (50%) Retracement & Continuation
Objective
Re-enter an established trend following a deep pullback to structural center.
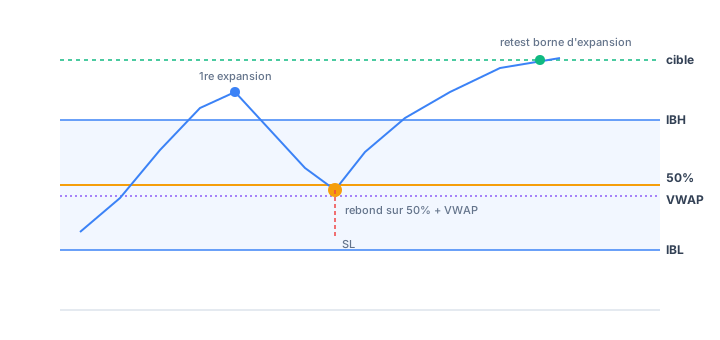 After the first expansion, the pullback finds midpoint and VWAP confluence before resuming toward the expansion boundary.
- Entry Conditions: Price retraces to the 50% IB midpoint after initial directional effort, demonstrating support/resistance validation with confluence (VWAP, EMA Flow Zones).
- Risk Management: Stop Loss placed past the structural swing high/low beyond the midpoint.
- Profit Target: Retest of the expansion IB boundary.
5. Order Flow & Confluence Indicators
- VWAP: Dynamic support/resistance level and primary profit target on Failed Auction setups.
- Volume Profile & CVD: Verifies value acceptance versus rejection and measures aggressive buying/selling pressure during boundary tests.
- EMA Flow Zones: Three paired exponential moving averages (13/21, 34/50, 72/89) to confirm and track trend momentum during expansion moves.
6. Trader Decision Workflow
- 9:30 AM - 10:30 AM: Stand aside. Allow the market to construct the initial range.
- 10:30 AM: Plot IBH, IBL, and the 50% Midpoint.
- Determine Market Regime: Assess whether the market is favoring an expansion (Setup 1) or rotational/failed breakout environment (Setup 2).
- Trigger Execution: Never buy direct breakout momentum without retracement to FVG/VWAP. Monitor price action around 11:00 AM EST for false breakout confirmations.